This blog contains experience gained over the years of implementing (and de-implementing) large scale IT applications/software.

Basic Performance Tuning Guide – SAP NetWeaver 7.0 – Part IV – ABAP Runtime Analysis

This is the final part of my SAP NetWeaver 7.0, Basic Performance Tuning Guide.
You may wish to review Part I, Part II or Part III.
In this part I will focus on the use of ABAP Runtime Analysis to check performance of ABAP programs/reports.  This will help you locate areas of ABAP that are eating up valuable response time.

Execute transaction SE30.
Enter the transaction (or program or function module) that you wish to analyse:

Edit the “Measurement Restrictions” variant to either create your own, or simply adjust the DEFAULT.
This will allow us to display additional information which can be very useful when trying to determine performance problems.

Tick the “DB-level ops” option on the Statements tab:

On the Duration/Type tab, select “None” for Aggregation and tick “With memory use”:

The transaction or program you entered will be run, but you should see a prompt at the bottom of the screen telling you that the measurement process has started:

Perform the actions you need in the transaction/program.
Once you have finished, simply click Back (exit from the transaction) to the SE30 main screen:

The SE30 screen will display a prompt showing the analysis has finished:

The trace data is stored in a file on the SAP instance server.
This can be seen by clicking the “File Info…” button:

You can see the file name and path:

If you need to load the trace data again for analysis, you can simply click the “Other File…” button on the main screen.
It’s also possible to transfer the analysis files via RFC to another SAP system from the “Other File…” sub-screens.
This is very useful if you want to compare performance between two systems.
NOTE: The performance data files are only retained on the server for eight days.  I haven’t found a way of extending this.

Let’s analyse the stats.
Click the Evaluate button:

You will see a basic breakdown of the transaction runtime performance analysis in histogram form.
The three different areas are shown (ABAP, Database and System) against time (as a percentage):

More details on this screen can be found here: https://help.sap.com/saphelp_nw70/helpdata/en/c6/617d27e68c11d2b2ab080009b43351/content.htm

The values shown correlate to the response times measured in the single record statistics plus the time required for analysis.
Note that DATABASE time above, also includes the time the system takes to open and close cursors etc, not just the SQL runtime.
For reference, the STAD output for the same operation (notice the slightly lower DB req time):

SAP STAD output DB request time

The most interesting buttons at the top of the SE30 screen are “Hit List”, “Table Hit List” and “Call hierarchy”.
 Click the Hit List button:

STAD output hit list

The Hit List will be displayed in descending order (gross time):
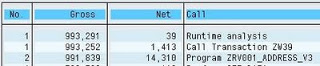
STAD output hit list output

The columns are defined as follows:

“No.” – Shows the number of times a call was made.
If a “SELECT” is performed in a loop, then this will show the number of times the call was made in total in the loop.

“Gross” – Total execution time in microseconds (running bottom to top of the hit list).
“Net” – The time in microseconds for the specific call(s)
“Call” – The program component that was being executed.
“In program” – The main program of the component.
“Type” – The type of call (DB, System, Non-system).

SAP says here https://help.sap.com/saphelp_nw70/helpdata/en/c6/617d27e68c11d2b2ab080009b43351/content.htm:
“Gross time
The total time required for a call. This includes the runtime of all modularization units and ABAP statements called by the subject.

Net time
The net time is the gross time less the time required for modularization units (MODULE, PERFORM, CALL FUNCTION, CALL SCREEN, CALL TRANSACTION, CALL METHOD, CALL DIALOG, SUBMIT), and for the ABAP statements listed separately. For statements such as APPEND, the gross time is the same as the net time.
“

In this view, you are looking for records in the list with the larger “Net” value.
This indicates that a large amount of overall time was spent in the call/program listed.

If the Gross and Net time fields do not hold the same value for a record, then double clicking the record will display the sub-components and switch to the hierarchy view:
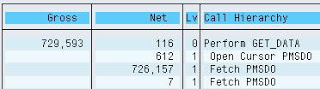
STAD output hit list sorting

At any time, you can single click a record, then jump to the ABAP source by clicking the “Display Source Code” button:

STAD output hit list call point in ABAP

STAD output hit list call point in ABAP

NOTE: I always recommend you enable the “New” ABAP editor.  It gives you visibility of line numbers and highlights the results of text “Find” operations so you can see what’s been found.

Back on the main analysis screen, select the “Table Hit List” button:

The list of tables used in the execution of the transaction/program are displayed in descending order of runtime:

STAD output hit list tables used

The #Acces column, displays the number of times the table was accessed (read/write) and corresponds to any loops you may have seen in the “Hit List” screen No. column.

The Class column shows TRANSP (Transparent Table), VIEW or POOL (cluster table).

Double click a table to display the call points, from which you can jump to the ABAP source.

Finally, from the main analysis screen, click the “Call hierarchy” button:

The Hit List that you have already seen, will now be displayed in a hierarchy with sub-calls indented under the parent call:
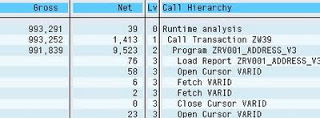
STAD output hit list call hierarchy

The only real difference between this view and the Hit List table view, is the indenting.
You can still double click to display the execution time overview for that sub-call, or use the “Display Source Code” button to jump to the ABAP source.

In my example screen shots, you will have seen that the PMSDO fetch is taking a large amount of the response time.
I was able to find that this operation was inside the GET_DATA function and check the ABAP code.

The main thing you are looking for in poor performing ABAP code, is where does the execution time get eaten up.  As a side note, you may also check the amount of memory used if you are looking to resolve TSV PAGE ALLOC errors.

Try sorting the Hit List by “Net Time” to find the individual components with the highest net execution time.
Check if the operation is a database related call or not.  You can then use Part III to trace this further with an SQL trace.
Check the number of loop iterations (The “No.” column) in the “Hit List”. Are you performing an expensive routine too many times in a loop?

Validate that the code is not doing too much work using iTabs, when some of the work could be done in the database.
The database is the ultimate place to do sorting, grouping and record elimination.
Don’t pull back more records than you need, only to loop through an iTab in ABAP and remove them, it’s more expensive.

That’s it for now.  Thanks for reading.

Lock/Unlock OEM Grid Control Accounts From Excel Macro


As a complimentary post to my previous blog post on Reporting All Oracle User Accounts Through OEM Grid Control, I have decided to post the code for an Excel VBA macro which uses three buttons to call the specific OEM Grid Control URLs that will enable you Lock/UnLock or Edit an Oracle user account using the OEM Grid Control user interface, but from a link on an Excel spreadsheet.

This sounds confusing so maybe I should explain the reason behind this.
I needed to know about all Oracle user accounts throughout the Oracle landscape so that I could compare them to a dump of Active Directory accounts.
The AD accounts get locked when people leave, but the leavers process didn’t always include the DBA in the ‘cc list.
So, armed with the Excel spreadsheet of AD users, I needed to marry the list to the Oracle accounts and then go and lock the Oracle accounts where the AD account had been locked/expired.

Sound OK so far?
Good.  So once I’ve got the Excel sheet with the ~200 Oracle accounts I need to lock, here’s how it could be done using OEM Grid Control (you can give the spreadsheet to your 1st line support people, if they have OEM access).

Three buttons on the spreadsheet:  Lock, UnLock and Edit.
Just paste the code into the sheet’s VBA section, then change the text “<your_oem_server>” and add the three buttons and hook them to the sub routines.
I should mention that this was an Oracle Enterprise Manager Grid Control 10g implementation.

Enjoy.

Private Sub CommandButton1_Click()
' Call to open IE with the URL to lock the user based on the data on the current sheet on the current selected row.

Dim str_URLpart1 As String
Dim str_URLpart2 As String
Dim str_URLpart3 As String
Dim str_URLpart4 As String
Dim str_URLpart5 As String
Dim str_complete_URL As String
Dim str_sys As String
Dim str_user As String
Dim IE As Object

str_URLpart1 = "https://<your_oem_server>/em/console/database/security/user?oname="
str_URLpart2 = "&amp;event=lockUser&amp;cancelURL=%2Fem%2Fconsole%2Fdatabase%2FdatabaseObjectsSearch%3Fevent%3Dredisplay%26target%3D"
str_URLpart3 = "%26type%3Doracle_database%26objectType%3DUSER%26otype%3DUSER&amp;backURL=%2Fem%2Fconsole%2Fdatabase%2FdatabaseObjectsSearch%3Fevent%3Dredisplay%26target%3D"
str_URLpart4 = "%26type%3Doracle_database%26objectType%3DUSER%26otype%3DUSER&amp;otype=USER&amp;target="
str_URLpart5 = "&amp;type=oracle_database"
str_user = Range("D" &amp; ActiveCell.Row).Value
str_sys = Range("A" &amp; ActiveCell.Row).Value
str_complete_URL = str_URLpart1 + str_user + str_URLpart2 + str_sys + str_URLpart3 + str_sys + str_URLpart4 + str_sys + str_URLpart5

' Create InternetExplorer Object
Set IE = CreateObject("InternetExplorer.Application")

' You can uncoment Next line To see form results
IE.Visible = True

' Send the form data To URL As POST binary request
IE.Navigate str_complete_URL

' Statusbar
Application.StatusBar = "URL is loading. Please wait..."

' Wait while IE loading...
Do While IE.Busy
Application.Wait DateAdd("s", 1, Now)
Loop

Application.StatusBar = ""

End Sub

Private Sub CommandButton2_Click()

' Call to open IE with the URL to unlock the user based on the data on the current sheet on the current selected row.

Dim str_URLpart1 As String
Dim str_URLpart2 As String
Dim str_URLpart3 As String
Dim str_URLpart4 As String
Dim str_URLpart5 As String
Dim str_complete_URL As String
Dim str_sys As String
Dim str_user As String
Dim IE As Object

str_URLpart1 = "https://<your_oem_server>/em/console/database/security/user?oname="
str_URLpart2 = "&amp;event=unlockUser&amp;cancelURL=%2Fem%2Fconsole%2Fdatabase%2FdatabaseObjectsSearch%3Fevent%3Dredisplay%26target%3D"
str_URLpart3 = "%26type%3Doracle_database%26objectType%3DUSER%26otype%3DUSER&amp;backURL=%2Fem%2Fconsole%2Fdatabase%2FdatabaseObjectsSearch%3Fevent%3Dredisplay%26target%3D"
str_URLpart4 = "%26type%3Doracle_database%26objectType%3DUSER%26otype%3DUSER&amp;otype=USER&amp;target="
str_URLpart5 = "&amp;type=oracle_database"
str_user = Range("D" &amp; ActiveCell.Row).Value
str_sys = Range("A" &amp; ActiveCell.Row).Value
str_complete_URL = str_URLpart1 + str_user + str_URLpart2 + str_sys + str_URLpart3 + str_sys + str_URLpart4 + str_sys + str_URLpart5

' Create InternetExplorer Object
Set IE = CreateObject("InternetExplorer.Application")

' You can uncoment Next line To see form results
IE.Visible = True

' Send the form data To URL As POST binary request
IE.Navigate str_complete_URL

' Statusbar
Application.StatusBar = "URL is loading. Please wait..."

' Wait while IE loading...
Do While IE.Busy
Application.Wait DateAdd("s", 1, Now)
Loop

Application.StatusBar = ""

End Sub

Private Sub CommandButton3_Click()

' Call to open IE with the URL to edit the user based on the data on the current sheet on the current selected row.

Dim str_URLpart1 As String
Dim str_URLpart2 As String
Dim str_URLpart3 As String
Dim str_URLpart4 As String
Dim str_URLpart5 As String
Dim str_complete_URL As String
Dim str_sys As String
Dim str_user As String
Dim IE As Object

str_URLpart1 = "https://<your_oem_server>/em/console/database/security/user?oname="
str_URLpart2 = "&amp;event=edit&amp;cancelURL=%2Fem%2Fconsole%2Fdatabase%2FdatabaseObjectsSearch%3Fevent%3Dredisplay%26target%3D"
str_URLpart3 = "%26type%3Doracle_database%26objectType%3DUSER%26otype%3DUSER&amp;backURL=%2Fem%2Fconsole%2Fdatabase%2FdatabaseObjectsSearch%3Fevent%3Dredisplay%26target%3D"
str_URLpart4 = "%26type%3Doracle_database%26objectType%3DUSER%26otype%3DUSER&amp;otype=USER&amp;target="
str_URLpart5 = "&amp;type=oracle_database"
str_user = Range("D" &amp; ActiveCell.Row).Value
str_sys = Range("A" &amp; ActiveCell.Row).Value
str_complete_URL = str_URLpart1 + str_user + str_URLpart2 + str_sys + str_URLpart3 + str_sys + str_URLpart4 + str_sys + str_URLpart5

' Create InternetExplorer Object
Set IE = CreateObject("InternetExplorer.Application")

' You can uncoment Next line To see form results
IE.Visible = True

' Send the form data To URL As POST binary request
IE.Navigate str_complete_URL

' Statusbar
Application.StatusBar = "URL is loading. Please wait..."

' Wait while IE loading...
Do While IE.Busy
Application.Wait DateAdd("s", 1, Now)
Loop

Application.StatusBar = ""

End Sub

Virtualisation Conundrum

Whilst researching ideas for using my VMware ESXi test rig, I came across this blog site: https://weinshenker.net/blog/2011/07/26/oracle-redhat-vmware/
I’ve added it to my Fav’s as a *must read* once in a while.
It’s packed with some very interesting articles concerning Linux, Virtualisation and more importantly, Oracle.

It may have changed my mind about using Oracle Enterprise Linux.  I’m considering shifting up the Linux tree to RedHat, or experimenting with Fedora.

See the Wikipedia tree diagram https://upload.wikimedia.org/wikipedia/commons/8/8c/Gldt.svg on the right of the Wikipedia Linux Distro page.

Use EMDIAG REPVFY to fix OEM issues

EMDIAG is a diagnostics utility specifically for the Oracle Enterprise Manager system.
It is useful to diagnose issues with the repository of OEM as it doesn’t need the OMS to be running to use it.

The Oracle document 763072.1 (Oracle Enterprise Manager Grid Control Release Notes for Linux and Windows 10g Release 5) suggests upgrading the EMDIAG kit before performing a general OEM upgrade (it’s in the OEM pre-upgrade tasks list).

Follow the steps in document 421499.1 to install the EMDIAG kit into the C: directory (you should see the old one already installed there).

Follow the process in the document for upgrading the EMDIAG kit and check the Windows environment variable for the EMDIAG_HOME value.

Once installed, use the “repvfy -version” command in the %EMDIAG_HOME%bin directory to verify the current installed OEM software.

To use EMDIAG, set your OracleHome from the command line:

set ORACLE_HOME=C:OracleHomesoms10g

Change to the EMDIAG_HOME bin directory and run repvfy:

Now fix the errors where possible (generic operations that EMDIAG can perform to fix common problems):

repvfy -fix

Some of the problems cannot be fixed automatically.
You can get more details by running verify with greater detail:

repvfy verify TARGETS -level 9 -detail

NOTE: You may want to redirect to a text file in Windows (> c:TARGET_details.txt).

The detailed view may open a can of worms for you.
Good luck!

Report All Oracle User Accounts Through OEM Grid Control

You know the problem: You have Oracle Enterprise Manager Grid Control 10g installed and all your databases are configured in it.
It allows you to manage your entire landscape.  Great!

All of a sudden, a “leaver form” pops on your desk from HR with a long list of people who have left the company recently.
Do they have accounts in your Oracle databases?
If you have only one or two Oracle databases to check, then you can use the power of Grid Control to sort out the list in a few minutes.
What if you’ve got 50+ databases?
What if you’ve got 100+ databases?
Don’t they say: “The little jobs are the most time consuming”?

You may maintain an external spreadsheet of Oracle accounts, or you may not.  If you do, or even if you don’t, this article will show you how to configure a Oracle Enterprise Manager Grid Control 10g report that will show you all users accounts across the landscape at the click of a button.  You could use this technique to extend it to almost anything that can be done in an SQL or PL/SQL session.

Architecture overview:

We will be creating a new OEM Grid Control job called LIST_USER_ACOUNT_DETAILS, and a new report called LIST_USER_ACCOUNT_DETAILS.
The job is executed on the monitored database targets and it stores it’s output in the usual MGMT$ table in the OEM repository database.
The report simply pulls and re-connects the job output.

In OEM Grid Control create a new job called “LIST_USER_ACCOUNT_DETAILS”.
Add the database targets or target group.

Set the SQL script to be:

SET HEAD OFF;
SET PAGESIZE 9999;
SET LINESIZE 999;
SET TRIMOUT ON;
SET TRIMSPOOL ON;
SET FEEDBACK OFF;
SET COLSEP ' ';
COL MARKER FORMAT A2;
COL USERNAME FORMAT A30;
COL ACCOUNT_STATUS FORMAT A25;
COL LOCK_DATE FORMAT A12;
COL EXPIRY_DATE FORMAT A12;
COL HAS_REMOVED_ROLE FORMAT A30;
COL HAS_DBA_ROLE FORMAT A20;
WHENEVER SQLERROR EXIT FAILURE;
SELECT
'@|' marker,
username||'|' username,
account_status||'|' account_status,
'|'||TO_CHAR(lock_date,'DD-MM-RRRR')||'|' lock_date,
'|'||TO_CHAR(expiry_date,'DD-MM-RRRR')||'|' expiry_date,
'|'||DECODE((SELECT 'X' FROM dba_role_privs WHERE grantee = username AND granted_role ='REMOVED_ACCOUNTS'),'X','HAS ROLE "REMOVED_ACCOUNTS"','')||'|' has_removed_role,
'|'||DECODE((SELECT 'X' FROM dba_role_privs WHERE grantee = username AND granted_role ='DBA'),'X','HAS DBA ROLE!!','') has_dba_role
from dba_users;

Set the Parameters to be “-s” (silent):

Set the Credentials to use an account capable of querying DBA_USERS and DBA_ROLE_PRIVS (you could change this to use ALL_ views and use a lower priviledged account).
Set the schedule for the job. However frequently you wish to query the account details.

Submit the job for execution.

Once the job runs, the job output will be visible in the OEM MGMT$JOB_STEP_HISTORY table.
The actual SQLPlus output is stored in the OUTPUT column which is a CLOB field.
We have had to insert a marker in the SQL so that the output contains a ‘@|’ at the beginning of each line. This is used to determine the start of each record in the OUTPUT CLOB.
We just need to write a report to pull out the details.

Create a new report called “LIST_USER_ACCOUNT_DETAILS”.
On the “General” tab, select the “Use the specified target” option and enter the hostname of your OEM Grid Control repository server (DB server).
Select the “Run report using target privileges of the report owner (SYSMAN)” tick box.

On the “Elements” tab, add a “Table from SQL” item and then set the header, then paste in the statement below:

SELECT TARGET_NAME,JOB_TIME,ACCOUNT_DETAILS FROM (
SELECT '===============' TARGET_NAME,'================' JOB_TIME,'==================================================' ACCOUNT_DETAILS FROM DUAL
UNION
SELECT
TARGET_NAME,
TO_CHAR(END_TIME,'DD-MON-RRRR HH24:MI:SS') JOB_TIME,
-- non-regexp option -- TO_CHAR(REPLACE(SUBSTR(mh.OUTPUT,INSTR(mh.OUTPUT,'@| ',1,ct.x),INSTR(mh.OUTPUT,'@| ',1,ct.x+1) - INSTR(mh.OUTPUT,'@| ',1,ct.x)),'@| ','')) ACCOUNT_DETAILS
TO_CHAR(REGEXP_SUBSTR(mh.OUTPUT,'[^@]+', 1,ct.x)) ACCOUNT_DETAILS
FROM MGMT$JOB_STEP_HISTORY mh,
(SELECT rownum x FROM ALL_OBJECTS WHERE rownum<=5000) ct
WHERE TARGET_TYPE='oracle_database'
AND JOB_OWNER='SYSMAN'
AND JOB_NAME LIKE 'LIST_USER_ACCOUNT_DETAILS.%'
AND STEP_NAME='Command'
)
WHERE ACCOUNT_DETAILS IS NOT NULL
ORDER BY TARGET_NAME, JOB_TIME;

NOTE: In the report SQL, we have assumed a maximum number of 5000 user accounts across all database targets.
If you exceed this (if you have a lot of user accounts) then you will need to increase the number.
We have also assumed that SYSMAN is the owner of the job that created the output. You should change this if necessary.

You can choose to schedule the report if you wish (you should take into account the source job schedule).
It's probably best to secure the report so that only administrators can see it.

Test the report.

The output format consists of the following columns:
 TARGET NAME
 JOB TIME
 ACCOUNT DETAILS {
                 USERNAME
                 ACCOUNT STATUS
                 LOCK DATE
                 EXPIRY DATE
                 HAS REMOVED ROLE
                 HAS DBA ROLE
                }

The "HAS REMOVED ROLE" column relates to a "flag" role that I use to denote that an Oracle account has been de-activated purposely.
Instead of the account being deleted, it is retained for audit purposes and the REMOVED_ACCOUNTS role granted to it. You can choose to ignore or adapt this column.

Once you have the output, you can extract it to Excel for comparison with an Active Directory dump or any other means.