This blog contains experience gained over the years of implementing (and de-implementing) large scale IT applications/software.

Dropping Empty SAP BW Table Partitions in SAP ASE

In a SAP BW 7.4 on SAP ASE database, table partitions are used as a method of storing data, primarily for query performance but also for object (table) management.

In this post I show a simple way to identify tables with many empty partitions, so that you can more quickly drop those empty partitions.
Less empty partitions reduces the downtime of database migrations, and can also increase the performance of business-as-usual queries.

Partitioning in SAP ASE

To use SAP BW on SAP ASE, the “partitioning” license needs to be bought/included in the database license.
The license is automatically included in the runtime license for ASE for SAP Business Suite.

SAP note 2187579 “SYB: Pros and cons of physical partitioning of fact tables” list all of the benefits and the options of partitions for ASE 15.7 and ASE 16.0.

During normal business usage, the database can use less effort to obtain data from a partitioned table, when the partition key column is used as a predicate in the query.
This is because the database knows exactly where the data is held.
It’s in its own table partition and is therefore more manageable.

A good analogy is to imagine that you have two holding pens, one with all cats, and one with all dogs. The partition key is “animal type” and each holding pen is a partition.
Both holding pens together make the table.
If we wanted to get all data from the table where the occupant was a cat, we simply go to the pen with all the cats and read the data.

Now imagine that we had 3 partitions that make up our table, but one of those partitions was actually empty.
In some cases, depending on the database settings, certain types of data queries will still scan for data in that empty partition.
These additional scans do not take a huge amount of time individually, but it does cause extra effort nevertheless.

If we upscale our scenario to a large multi-terabyte SAP BW system, and to a BW FACT table with thousands of partitions.
Imagine if we had thousands of empty partitions and we were accessing all records of the table (a full table scan), this would give a reasonable delay before the query could return the results.
For this exact reason, SAP provide a BW report.

The Standard SAP BW Report

The standard ABAP report SAP_DROP_EMPTY_FPARTITIONS is specifically for the FACT tables of a BW system and it is a recommendation in the ASE Best Practices document for this report to be run before a BW system migration/copy is performed.

By reducing the empty partitions, we also reduce the system export time. Easy winner.

The problem with the SAP standard report, is that you will need to go through each individual BW info-cube and execute the report in “show” mode.
This is really, really painfully slow.

A Better Way

Instead of the standard report, I decided to go straight to the DB layer and use SQL.
The example below is for SAP ASE 16.0 (should work on 15.7 also):

select distinct 
       convert(varchar(20),so.name) as tabname, 
       t_spc.numparts-1 as num_parts, 
       t_spn.numparts-1 as num_emptyparts 
from sysobjects so, 
     (select sp1.id, 
             count(sp1.partitionid) as numparts 
      from syspartitions sp1 
      where sp1.indid = 0 
      group by sp1.id 
     ) as t_spc,
     (select sp2.id, 
            count(sp2.partitionid) as numparts 
      from syspartitions sp2, 
           systabstats sts 
      where sp2.indid = 0 
        and sp2.partitionid = sts.partitionid
        and sts.indid = 0 
        and sts.rowcnt = 0 
      group by sp2.id 
     ) as t_spn 
where so.name like '/BIC/F%' 
  and so.id = t_spc.id 
  and so.id = t_spn.id 
  and so.loginame = 'SAPSR3' 
  and t_spn.numparts > 1 
order by t_spn.numparts asc, so.name

It’s fairly crude because it restricts the tables to those owned by SAPSR3 (change this if your schema/owner is different) and it is looking for FACT tables by their name (“/BIC/F*”) which may not be conclusive.

Below is an example output of the SQL versus the report SAP_DROP_EMPTY_FPARTITIONS in “show” mode:

You can see we are only 1 count out (I’ve corrected in the SQL now) but essentially we get a full list of the tables on which we can have the most impact!

Let’s look at a sample SELECT statement against that table:

We used the following SQL:

set statistics time on 
select count(*) from [SAPSR3./BIC/FZPSC0201]
go

Execution time on that statement was 25.9 seconds (elapsed time of 25931 ms).
We spent 2 seconds parsing and compiling the SQL statement (lots of partitions probably doesn’t help this either).
Since the CPU time is only 7 seconds, we have to assume that I/O was the reason for the delay while ASE scanned over the partitions.

Dropping The Partitions

Let’s go ahead and actually drop those empty partitions using another standard ABAP report SAP_DROP_EMPTY_FPARTITIONS.

NOTE: See SAP note 1974523 “SYB: Adaption of SAP_DROP_EMPTY_FPARTITIONS for SAP ASE” for more details on how to use the report.


We need to run this in the background, because dropping over 1,000 partitions will take a while.

Once dropped, we can re-run our select statement:

Total elapsed time is now down to just 6 seconds.
Admittedly there could be some time saving due to the data cache and plan cache already being populated for this table, so I ran ASE stored procedure: sp_unbindcache, which seemed to have done something.
Then I re-ran the query:

Being unsure if the unbind worked or not (I could not bounce the DB to be absolutely sure), I’m going to just accept that we have improved the result by dropping those empty partitions.

Analysing High SAP Roll Wait Time – NW702

One of my clients identified an increase in the Response Time measurements they monitor.  They use the EarlyWatch Report to monitor the SAP system SLAs against response time performance.
I initially thought this was going to a be a nice easy assignment, identify the database performance issues and propose some reorganisation work.  After all, this does seem to be the case in ~75% of the cases I’ve seen.

Basic info: SAP NW 702 on Oracle 11gR2 on Unix.
SLAs are monitored against DIALOG response time from 9am to 6pm weekdays only.

I brought up the ST03 screen and checked the “Ranking Lists -> Top Response Time of Dialog Steps” (also known as the Hit List) for the past 3 month’s data, one month at a time.
All three months showed a similar pattern.  The worst performing reports were customer developed reports.  The database time looked reasonable (< 40% of Response Time – Wait Time), processing time was long-ish and load/gen time was tiny.
What didn’t look good was the “Roll Wait Time”.

I backtracked a step and looked again at the “Workload Overview”, and specifically tab “Parts of response time“:
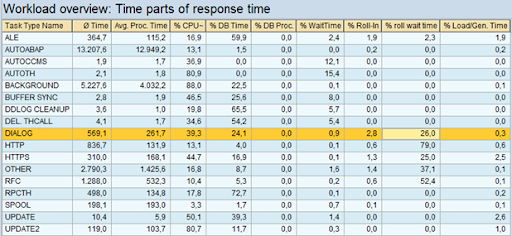
MWSnap101 2014-01-02, 09_55_04

That’s right, 26% of the response time for Dialog, is Roll Wait time.
Time to dig out the definition of SAP Roll Wait Time…
I’ve blogged about the basic performance tuning steps before, but I’ve yet to deep dive into the Roll Wait Time metric.

What is “Roll Wait Time”.
SAP note 8963 says:

The roll wait time is time that elapses on the client while the user context is in the roll area. Therefore, no resources are used on the client and there is no bottleneck here if the roll wait time is long.

So we may not be looking at a problem with the SAP server, but a problem between the SAP application and the front-end.
The note goes on to state that for DIALOG processing, the roll out of the context can be caused by calls to other external applications from the R/3 system, or from a call to an external RFC.
More importantly, it says:

As of Release 4.6, roll wait times also occur when the R/3 system communicates with the controls in the front end. While the data in the front end is processed, the R/3 context is rolled out, and the work process is released as a result. This may occur several times during a transaction step. If front-end office applications (such as Microsoft Word) are started and only closed after a long time (more than several minutes), a very long roll wait time also occurs.

This means that the communication to the front-end (SAP GUI, Microsoft Excel, Word etc), can cause the DIALOG work process to roll out, subsequently increasing the “Roll Wait Time”.
Even further clarification is provided in SAP notes 364625 and 376148 which mention the “new” GUI controls introduced in R/3 4.7.
SAP note 606610 explains how an ABAP “WAIT” command causes a task to roll-out of the work process.

SAP note 203924 provides some more detailed information on high Roll Wait Time:

As of Release 4.6 the roll wait time (and therefore the total response time) contains the time for installing “Enjoy Elements” (=controls) and therefore the essential part of the communication between the GUI and the R/3 instance. In this case, the response time displayed in Transaction ST03 is closer to (almost identical to) the time experienced by the user.

Plus it also confirms what we’re thinking:

As of Release 4.6, therefore, a high roll wait time is a first indication of a slow network between the GUI and the R/3 instance.

Section 2a of the note provides some good pointers in diagnosing network performance issues and checking the size of the SAP user menus.

As per the note, I opened up transaction ST06 and via the “Detailed Analysis” button, I went to the “LAN Check by PING” screen, then clicked “Presentation Server“:
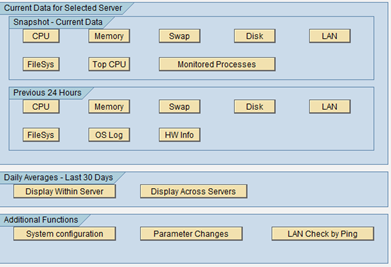
 MWSnap104 2014-01-02, 10_57_13

MWSnap105 2014-01-02, 10_57_22

MWSnap106 2014-01-02, 11_02_32

Once here, I selected a random selection of “Presentation Server” clients and initiated a 10x PING.
What I found was that specific “Presentation Servers” (client PCs) were not responding within the expected 20ms:

 image

I knew that we were operating in a WAN environment (multiple offices across different cities) so I should be expecting a WAN connection time of between 50ms and 250ms (according to SAP note 203924).
I was seeing ~60ms in some cases.  So I can conclude that we have a moderately quick WAN setup.
The main point is that I was not seeing any packet loss.  Which is a good sign.

Whilst the immediate data is always good to see, it’s worth mentioning that the speed could be circumstantial.  It’s best to check the times in our ST03 statistics.  Opening up ST03 again and navigating to the “Workload Overview” analysis view, I can see on the “Times” tab, an “Average GUI Time per Dialog Step” of 90.4ms:

image

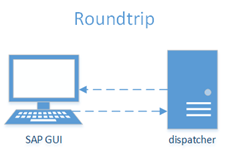
round trip

  GUI Time

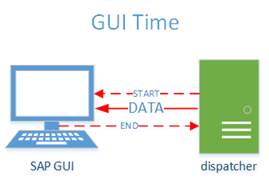
GUI Time:  Measured at the Application Server, this is the average time taken for all requests (of a Dialog step) to go from the Application Server to the front-end SAP GUI (it does not include the time taken for the SAP GUI to send data to the Application Server).
The time I see is not too bad and will vary depending on the amount of data sent.

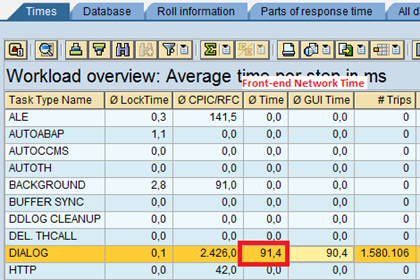
We can verify the value by checking the “Average Front-end Network Time” (per Dialog step):
image

  Front End Network Time

Front-end Network Time:  Measured at the SAP GUI, we see that the Front-end has recorded an average of 91.4ms time taken for the first request (of a Dialog step) to go from the Application Server to the front-end SAP GUI, plus the time taken for the last request (of a Dialog step) to go from the Application Server to the SAP GUI plus the processing required on the front-end for screen formatting.  This roughly agrees with our network finding of 60ms ping time (with no GUI processing at all), which means that on average, we’re probably seeing ~30ms of time for the SAP GUI to perform it’s rendering.

Based on the above findings I can rule out networking as being a probable cause to the high Roll Wait Time as it seems to be (on average) pretty normal.  Although I could recommend to my client that they use the “Low Speed Connection” setting in the SAP GUI as this is recommended by SAP in WAN setups (see SAP note 203924 section 4).  It’s also possible I could recommend reverting to the Classic Theme in the GUI.  Also recommended in the mentioned note.

SAP note 62418 discusses the typical amount of data sent per Dialog step in SAP ECC 6.0.  Around 4.6KB is to be expected (per Dialog step).  It doesn’t state if that is a normal connection setup or using the “Low Speed Connection” setup.
We can also look at the relationship of GUI Time to Roll Wait Time.  There’s something there that doesn’t look quite right.

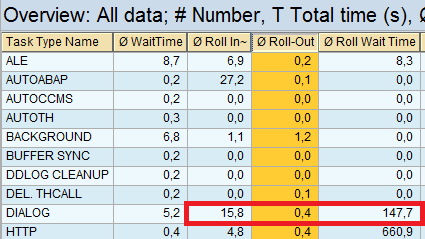
If I go back to the Workload Overview, I can see that for DIALOG tasks, the “Average GUI Time” is 90.4ms, which should be almost equal to the “Roll-out” + “Roll Wait” + “Roll In” (these happen whilst the GUI is doing it’s stuff – during RFC).

Except, in my case, I can see that the GUI (plus the time to talk to it) is doing it’s stuff much quicker than the Application Server is rolling out and waiting (NOTE: We’ve had to drag the columns around in ST03 and we’re on the “All Data” tab):
image

0.4 + 147.7 + 15.8 = 163.9ms.

This is 163.9 – 90.4 = 73.5ms slower (on average, per Dialog step) than I would have expected!
This is ~12% of the response time (the Roll Wait Time is ~26% of the response time).

These are the possible reasons I considered to explain this:

  • Bad network performance.  We’ve looked at this and we can see that GUI Time is actually pretty normal.  Why would waiting around take longer than the time to do something.  Network performance seems good.
  • Lack of dialog work processes.  No it can’t be this, because this would not be attributable to Roll Wait Time, but instead would be measured as Dispatcher Queue Time (also known as “Wait Time” without the word “Roll”).
  • Longer time to  Roll In and Roll Out.  It’s possible that Roll In and Roll Out time could affect the calculations.  I’m seeing average Roll In time (per dialog step) of 15.8ms and Roll Out time of 0.4ms.  But this still doesn’t add up to 73.5ms.
  • Time taken to initialise and open the RFC connection to the SAP GUI.  It’s possible that the network lookup/hostname buffer is slow to get going before we manage to open the connection to the SAP GUI, but 75ms is pretty slow.

I needed to get out of the aggregated data and into the real nitty gritty.
I needed transaction STAD and some real live data.

Opening STAD, I left the default options with a read time of 10 minutes ago.
Once the records were displayed, I changed the layout of the screen to remove fields I wasn’t interested in, I then added fields I was interested in:
– Started
– Server
– Transaction
– Program
– Type
– Screen
– Work Process
– User
– Response Time
– RFC+CPIC
– Roll Wait
– GUI Time

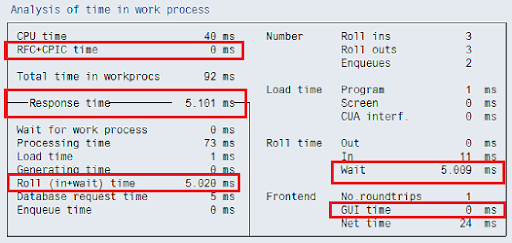
Once I had the screen setup, it was a simple case of scanning through the records looking for any that had “Roll Wait” > “GUI Time” with 0 “RFC+CPIC”.

I found some!
One of the records (shown below) has a huge “Roll Wait” time of around 5 seconds, yet “GUI Time” is zero:
 image

It just so happens that at the same time as this STAD record was created, I was also running an Enqueue Trace, SQL Trace and Buffer Trace from transaction ST05 (yeah, it was a quiet day so I felt confident that dipping in and out of tracing wouldn’t hurt performance too bad).

So I had an opportunity to display these traces for the same period of time (and the same Work Process number).
I found that there were no long durations in the entire trace.  In fact, the total duration of the trace period didn’t add up to even 1 second.  What!

Sorting the trace by the “Time” column and manually scrolling through looking for the 5 seconds between one row and the next and sure enough, I found it.  The missing 5 seconds:

image

  image

I single clicked the first record after the time gap, and because it was an ABAP program, I was able to click the “Display Call Positions in ABAP Programs” button:

image

image

The source code position that I arrived at didn’t seem to be doing anything other than an OPENSQL statement, so I scrolled back up the program a little.
Then I saw it.  The program was moving UNIX files around.  Not only that, but there was an ABAP command “WAIT UP TO 5 SECONDS.”:

image

image

Here’s what the ABAP syntax help says:

This statement interrupts the execution of the program by the number of seconds specified… … after the specified time has passed, the program continues with the statement following WAIT.

It also states:

Each time the statement WAIT is used, a database commit is performed.  For this reason, WAIT must not be used between Open SQL statements that open or close a database cursor.


SUMMARY:

We’ve seen how “GUI Time” is measured and checked the network performance stats to see how accurate it is.
We’ve also learned how “GUI Time” is actually related in some ways to the value of the “Roll Wait Time”.

It’s been a long hard slog to get to the bottom of why I have a high average “Roll Wait Time” shown in ST03, when the average “GUI Time” is much lower.  A hardcoded ABAP statement was causing my work processes to WAIT for a fixed period of time, increasing the overall Response Time reported in ST03.  We referenced SAP note 606610 at the beginning of our article, but it seems very difficult to actually find out (without going through ABAP source) if a WAIT statement is has been the cause of Roll Wait Time.

We have subsequently learned that the ST03 Dialog Response Time measurements should be taken lightly, and that you should always try to exclude “GUI Time” by using the “Response Time Distribution” analysis view and clicking the “Dialog Without GUI Time” button.  This will exclude the “Roll Wait Time” as described in SAP note

ADDITIONAL NOTES FOR REFERENCE:
During my investigation, I also found a few other things.

We were actually suffering from the program error described in SAP note 1789729, so there is some potential to get better performance from the system by eliminating the additional database & buffer calls.

Some of the records in STAD contained HTTP records.
When I analysed these, I could see that certain document related transactions were calling out to the SAP HTTP Content Server to access documents.
I managed to calculate that the “Call Time” for the HTTP access, was recorded as “Processing Time” in the overall Response Time.
So, if you use a Content Server, be sure to check the response times, as this could also be a factor in slower response times, and this wasted time *is* recorded in the overall Response Time.
Obviously, using SSL will make this process slightly slower, so maybe some form of front-end cache would be better.

Thanks for reading.

HowTo: SAP NW731 Java Full HTTP Trace With Headers Content & Timings

Scenario: You have a SAP Java stack which is hosting either some SAP components/modules, or it’s hosting your own custom Java code.
You would like to perform a full HTTP trace so that you can see the HTTP headers and returned content during a HTTP session between your browser and the SAP HTTP Server.  You also wish to see timings for the processing time of the response.
Following SAP note “724719 – How to enable HTTP tracing in the SAP J2EE Engine 6.40/7.0”  connect into the SAP Netweaver Administrator main web page as J2EE_ADMIN:
SAP NWA J2EE_ADMIN
On the left-hand side, select “System Properties”:
SAP NWA System Properties
Select the dispatcher item under “<SID> -> Instance -> Dispatcher”:
SAP NWA System Properties despatcher
On the Services tab, select “http”:
SAP NWA System Properties despatcher http service
In the “Properties” tab at the bottom, select “HttpTrace” and click the “Modify” button:
SAP NWA System Properties dispatcher http service httptrace
image
Now change the trace setting to the following:
SAP NWA System Properties dispatcher http service httptrace enable
The possible values are described in the SAP note as:
enable
         Using this option will cause the whole requests/responses to be written
enableHeaders
        Using this option will cause only the headers of each request/response to be written
enableHex
        Using this option will cause the whole requests/responses to be written in a 16-column hexadecimal format. This option is valid for J2EE Engine SP10 or higher
enableHexHeaders
        Using this option will cause only the headers of each request/response to be written in a 16-column hexadecimal format. This option is valid for J2EE Engine SP10 or higher
The SAP note also recommends to set the property HttpTraceTime, to “true”.
This is described further in SAP note “972540 – Tracing dispatcher and server response times“.
Since you would only get the dispatcher processing time, you should also set the server trace property as described in the above note, to allow you to see the server processing time:

1) dispatcher + server processing time trace in http access log
– On the dispatcher enable Http Provider#s property #HttpTraceTime#
– On the servers enable Http Provider#s property #LogResponseTime#
Then messages in the httpaccess response file will contain additional fields  d[…] and c[…] where d is dispatcher and server processing time and c is client id.
2) additional traces – if the request is processed for more than XX seconds
– there is a new Http Provider#s property on the server # #TraceResponseTimeAbove#
– if its value is -1 then there will be no additional traces
– if its value is >-1 (the value represents the response time in ms)
    then additional traces will be written in the default trace file only for these requests which response time is >= property#s value
– on the servers put the log severity for HttpProvider service to DEBUG

Once you have enabled the tracing, no restart of the Java stack is required.  It is activate immediately.
Simply check the trace output file /usr/sap/<SID>/<instance>/j2ee/cluster/dispatcher/log/services/http/req_resp.trc  (for NW731+) using operating system level file viewers (or AL11 in an ABAP stack).
For information, you should be aware of the HTTP 1.1 status codes, so you know what to look for if you are tracing an authorisation error (HTTP authorisation) or some other HTTP related issue  https://www.w3.org/Protocols/rfc2616/rfc2616-sec10.html .

HowTo: Read ST03 IO Redo Log Per Hour, Log Switches in SAP

Within the SAP St03 transaction, the analysis view “Wait Event Analysis -> IO Redo Log Per Hour” or “Redo Log Switches” (from SAPKB70029 onwards), is able to show you the Oracle redo log switch measure.
SAP Oracle IO Redo Log Per Hour
You will need to adjust the “Minimum Time Between Switches[sec]” and “Maximum Time Between Switches [sec]” values, then click the refresh button.
The results tell you in what hour period, the number of times a redo log switch was performed where the time between the switches was within your defined range.
As an example, the screen shot above shows that on 29-11-2013 between 04:00 and 05:00, a redo log switch occurred on only 1 occasion where the time between one log switch and another was within 120 seconds (2 minutes).
It’s difficult to say if too many log switches is an actual problem for your specific database, but I would tend to investigate any database where the logs are switching on more than a couple of occasions a day, within 60 seconds.

Solaris 10 – Asynch I/O on UFS – Not Really

Whilst investigating a performance issue on an Oracle 10.2.0.5 database running on Solaris 10, I had to do a little digging to discover exactly how asynchronous I/O is implemented within Oracle when the database is using the UFS filesystem.

It was not as straightforward as i thought, because I had to start from the beginning and not trust any current Oracle settings.  For example, FILESYSTEMIO_OPTIONS was set to “ASYNCH” in the spfile.
This would normally indicate that a DBA has specifically determined that ASYNCH I/O is possible and that they do not want to use DIRECTIO (or concurrent I/O).

Yet, reading the SAP notes, you would think that this is a moot point.
SAP note  830576 “Parameter recommendations for Oracle 10g” v227 clearly states that Oracle 10.2 on Solaris with UFS filesystems, supports asynchronous I/O, so therefore set the FILESYSTEMIO_OPTIONS to “SETALL”.

However, if you have access to “My Oracle Support” you can check Oracle document “SOLARIS: Asynchronous I/O (AIO) on Solaris (SPARC) servers (Doc ID 48769.1)” which explains that, in Solaris with UFS, Oracle does not actually perform asynchronous I/O at the kernel (Solaris) level.  Instead, Solaris simulates AIO by performing parallel writes (calls pwrite() ) but to Oracle it still looks and feels like KAIO.
So, the details in the SAP note are not exactly accurate.  AIO is not supported in Solaris, but is simulated.  Also, the simulation is just issuing more parallel I/O requests. 

If your disk sub-system is slow, it’s still going to be slow, but Oracle writes might be slightly faster if you handle/tune for more parallel requests at the storage layer.

Here’s a nice article that explains it really well:  https://sunsite.uakom.sk/sunworldonline/swol-07-1998/swol-07-insidesolaris.html