Why wouldn’t they.
As an operations specialist (https://www.it-implementor.co.uk/2011/06/are-you-sure-im-not-consultant-not.html), you get called in.
Of course, you’re an expert and you know that profiling a system is one of those tasks that needs to be done to help you troubleshoot performance problems. But being an expert, you also know that there are bigger fish to fry after a fresh implementation of anything.
So we assume that it is not plausible to use a comparative profile of before and after performance.
Let’s assume that a report/transaction has been reported as running slowly today by a single user (one helpdesk ticket
https://lukasland.com/humour/Computing-General/Help-Desk-Hell.htm).
You’re on the case and you can look at the problem right now.
What’s you’re first call?
Wrong! Crying won’t get you anywhere!
We need to see if the problem is caused by the system in general, the user (sometimes you do get them) or something else.
I always use the following methods:
1, Check SM66 (global work process overview). It’s easier than checking SM50, then remembering that you’re on a system with Apps servers (additional dialog instances).
What’s currently running?
Look specifically at the “Time” and “Action” columns:

If there are any long running programs (large “Time” values) in the list, what “Action” are they performing? Could it affect the report that the user has identified as being slow?
2, Check SM21 (System Log) always good to keep abreast of potential system wide issues! Brownie points (https://en.wikipedia.org/wiki/Brownie_points) from the big boss for being so quick!
Any problems in here will also mention short dumps in ST22, so no need to check ST22 unless it’s in the system log.
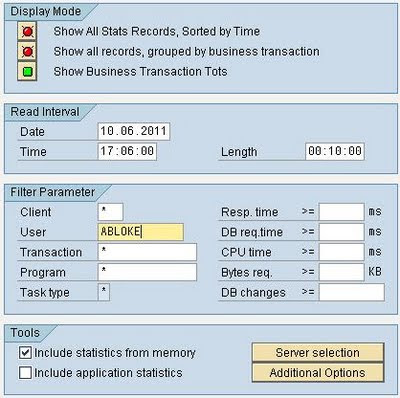
3, Check STAD (SAP Workload – Single Business Transactions). This shows specific transactions that the user has completed in the <n>hours (after this they get aggregated and shown in ST03N/ST03G depending on your collector settings).
Use the “Show Business Transaction Tots” option, it’s easier to see the wood for the trees (https://www.woodfortrees.org/).
Enter the username into the filter and adjust the time period to search for (when did the problem happen?).

Great! You can see the individual transactions performed by the user (even ITS based services e.g. BSPs will be shown):
TIP: Try it without the filter on a small system to see what you can actually get. It’s quite a lot of information. RFCs, background jobs, HTTP.

Check out the “Response Time”, “CPU time” and “DB req time” columns.
See if any specific transaction stands out above the rest for these three values.
If you expand the “+” folder on the very left, you will see each dialog step (screen) that the user has been through:

The time gap between each screen is the previous screens response time + roll-time + front-end time + “Think Time”.
So now you’ve found the slow program, you need to analyse it.
Part II of this guide shows how to read and decipher the single record statistics using STAD.
Part III of this guide shows how to perform an SQL Trace.