This is Part III, you may like to see
Part I and
Part II (or skip to
part IV).
Once you have traced the poor performing program (see Part I of this guide), and you have identified that your problem is in the database response time (see Part II of this guide), then you can start digging deeper into the potential SQL problem by running an SQL trace using transaction ST05.
In ST05, click the “Activate Trace with Filter” button:
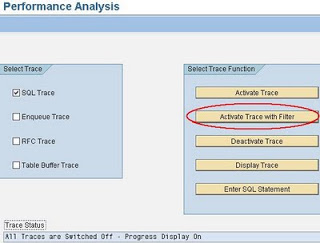
Unless you select the additional tick box “Table Buffer Trace” on the main ST05 screen, to show table buffer accesses, all the trace details in ST05 will be for direct database accesses (bypassing the table buffer).
Since direct database accesses will take longer than the buffer accesses, it is generally accepted that the longer runtimes will be associated with direct database access.
Enter your user id and the name of the report/transaction. This is so that we can try to limit the records in the trace. If you want to trace another user, simply enter their user id:
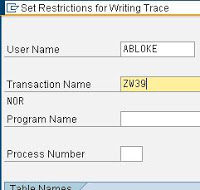
Click Execute to start the trace:

Now in a separate session (preferably) run the transaction/program with the performance problem.
Once you’re happy you have experienced the problem, you can go back into ST05 and click “Disable Trace” (by default it will remember the trace details and disable the running trace, you won’t need to re-enter all the details):

Still within ST05, click “Display Trace“:

The system remembers the last trace recorded and should automatically populate the details, but you can always enter them for date/time, user id etc:
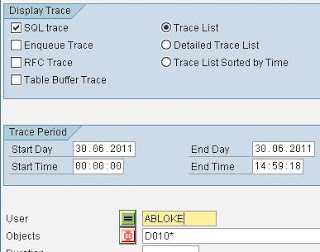
The SQL trace records are displayed.
The poor performing SQL has it’s time (duration) in microseconds (millionths of a second) highlighted in red if it exceeds 10000 microseconds, 10 milliseconds or 0.01 seconds:
(1 second = 1000 milliseconds = 1000000 microseconds)

At the top of the window we can see the transaction name (ZW39), the work process responsbile for executing the dialog step in which our statement was contained, the type of work process (DIA or BTC), the client and user and transaction id.
The OP column shows that this session has reused an existing cursor in the DB for this query.
This is because it has a “PREPARE” operation as the first OP before the cursor “OPEN” and not a “DECLARE” (see here https://help.sap.com/saphelp_nw04/helpdata/en/d1/801fa3454211d189710000e8322d00/content.htm).
If the session re-executed this query at another point in the trace, then it is likely (depending on code and available database resources), that the query would have re-used the existing cursor and even no “PREPARE” would have been visible, just OPEN and FETCH (https://help.sap.com/saphelp_nw04/helpdata/en/d8/a61d94e4b111d194cb00a0c94260a5/content.htm)
The deep yellow colour of each line will alternate between a dark and lighter colour when the table (obj name) changes in the list.
The RECS column shows the number of records retrieved in the “FETCH” operation.
The RC column shows the Oracle database return code 1403 (ORA-1403) which you get when you call “FETCH” in a loop and reach the end of the results (see SAP note 1207927).
The STATEMENT column shows the pre-parsed SQL including bind variables (:A1, :A2 etc).
The second line of the STATEMENT column shows the statement in the “OPEN” database call where all the bind variables have been normalised.
Double clicking on the STATEMENT column delves into the SQL statement a little more:

Here you will see the SQL statement in full (above) and the bind variables, their data types (CH,3 = CHAR(3)) and respective values.
Back on the main trace screen, with the SQL statement selected (single click), you can click the “Explain” button:

Again, you will see the SQL statement with bind variables (remember you can get the values from the other screen) but more importantly, you will see the Oracle Explain Plan.
The Explain Plan shows how the Oracle optimizer *may* choose to execute the statement and the relative costs associated with performing the query (I’ll explain more on this in a later chapter of this guide).
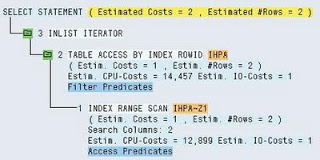
In the above example, you can see that Oracle has chosen to perform an Index Range Scan on index “IHPA~Z1” before going to the table IHPA to get the matching data rows.
Single click the “Access Predicates” on the index and you can see what will be applied to the index scan:


Again, you will need to reference the very first SQL view screen to get the bind variables values.
Clicking the name of the index will show the statistics values for the index:

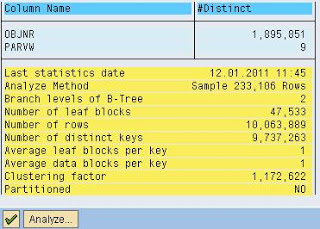
You can see the two columns that make up the index (objnr and parvw).
The Analyze button can be clicked to update the index database statistics real-time or as a background job.
WARNING: Be aware that SAP collects statistics in Oracle using it’s own set of predefined requirements as per SAP notes 588668, 1020260 and that you *must* disable the standard Oracle stats gathering jobs as per note 974781. Therefore, the stats may be out of date for a good reason.
The same detail can be seen when clicking the table name.
Back on the main screen, for those who have more knowledge of reading Oracle Explain Plans, you can choose the “EXPLAIN: Display as Text” button, which will display a more detailed Explain Plan that can be copied to a text editor also (I find this very useful):

Plan hash value: 1636536768
----------------------------------------------------------------------------------------
| Id | Operation | Name | Rows | Bytes | Cost (%CPU)| Time |
----------------------------------------------------------------------------------------
| 0 | SELECT STATEMENT | | 2 | 82 | 2 (50)| 00:00:01 |
| 1 | INLIST ITERATOR | | | | | |
|* 2 | TABLE ACCESS BY INDEX ROWID| IHPA | 2 | 82 | 1 (0)| 00:00:01 |
|* 3 | INDEX RANGE SCAN | IHPA~Z1 | 2 | | 1 (0)| 00:00:01 |
----------------------------------------------------------------------------------------
Query Block Name / Object Alias (identified by operation id):
-------------------------------------------------------------
1 - SEL$1
2 - SEL$1 / IHPA@SEL$1
3 - SEL$1 / IHPA@SEL$1
Predicate Information (identified by operation id):
---------------------------------------------------
2 - filter("MANDT"=:A0)
3 - access(("OBJNR"=:A1 OR "OBJNR"=:A2 OR "OBJNR"=:A3) AND "PARVW"=:A4)
Column Projection Information (identified by operation id):
-----------------------------------------------------------
1 - "OBJNR"[VARCHAR2,66], "PARVW"[VARCHAR2,6], "PARNR"[VARCHAR2,36],
"ERDAT"[VARCHAR2,24]
2 - "OBJNR"[VARCHAR2,66], "PARVW"[VARCHAR2,6], "PARNR"[VARCHAR2,36],
"ERDAT"[VARCHAR2,24]
3 - "IHPA".ROWID[ROWID,10], "OBJNR"[VARCHAR2,66], "PARVW"[VARCHAR2,6]
Finally, it’s possible to see the point in the ABAP program where the SQL statement was run.
Single click the statement column, then click the “Display Call Positions in ABAP Program” button or press F5:

The ABAP code will be displayed, and if you are using the new ABAP editor (I think you should), you will be positioned on the statement:

Looking at the ABAP statement, you can see how it has been converted from an OPEN SQL statement into an Oracle SQL statement.
The use of the “IN” keyword has been translated into multiple “OR” statements at the Oracle level.
Once at the ABAP statement level, it is sometimes required to know both Oracle SQL and ANSI SQL, since Oracle generally uses it’s own dialect and SAP uses ANSI SQL.
Therefore, you may see the original statement in a somewhat different form, especially when a table join is required on two or more tables.
Lastly, you will notice that the MANDT field is not present in the original ABAP, but it gets added to the predicate list by the ABAP OPEN SQL processor unless you use the “CLIENT SPECIFIED” keyword.
Armed with the SQL performance facts, the knowledge of how to perform an SQL trace and how to link this back to the piece of ABAP code; you should be able to use your database level investigative skills to work out why the statement is causing poor performance.
Make adjustments in the test system and see how the changes affect the performance.
I like to modify the Oracle SQL captured in the SQL trace, then enter it into ST05 (Execute SQL option) with the Explain button, to see if the explain plan is any better.
Some pointers:
– How much data is in the database tables being referenced?
– Is the Explain Plan showing that the query is making best use of available indexes?
– Can you replicate the problem in the test system?
– If this is a custom table, do you need to add additional indexes?
– Could the ABAP OPEN SQL statement be re-written to be more effective (use one query instead of two)?
– Are you SELECTing more fields than you actually need?
You may wish to read the master class in reading Explain Plans from Oracle.
I have blogged before about cardinality in Explain Plans here.
Find part IV of this blog post, here.