In Solution Manager 7.1 “
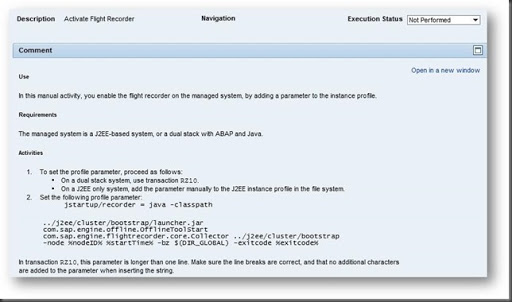
Managed System Configuration” step 7, you are requested to manually apply an instance profile parameter (jstartup/recorder) that configures the “Flight Recorder”:


The help for the item shows the following:

But the help doesn’t tell you what the Flight Recorder does and when you might use it.
So it was time to do a little research.
What does the flight recorder do?
Simply put, the flight recorder starts up only when a SAP Java server process (JVM) crashes (e.g. server0 crashes).
The flight recorder’s job is to gather up any available logs and traces and zip them up, before the system restarts the process.
Where are the dump zip files?
The zip files are stored by default in DIR_GLOBAL/dumps (e.g. /sapmnt/<SID>/global/dumps).
Typically the zip file is about 1-2MB in size and can contain around 1250 files.
What is included in a dump zip?
If you unzip a dump zip file, you will notice you get 3 different types of files extracted.
1– File system properties and config files, that were present on the file system at the time of the dump.
2– Database properties and config, that were stored in the database at the time of the dump.
3– Log files and traces, that were stored on the file system at the time of the dump.
Apart from looking in the DIR_GLOBAL/dumps area, trace or logs files, how can I see these dump zip files?
When you log into the System Info page of the Java server, you will see on the right hand side “Info for crashes of this node”:
https://<server>:5##00/monitoring/SystemInfo


How can we trigger a dump to see if this is all true?
Simple, we can just kill the server0 process like this:
DO NOT DO THIS IN PRODUCTION.
sidadm> ps -ef | grep server0
sidadm> kill 12345 <– This is the PID output from the previous command.
You will not really see the flight recorder process active, it’s very quick.
You will see the dump generated in the dumps folder.
Hopefully now, you can make use of the flight recorder.